Visualization and Histograms with ggplot2 in R
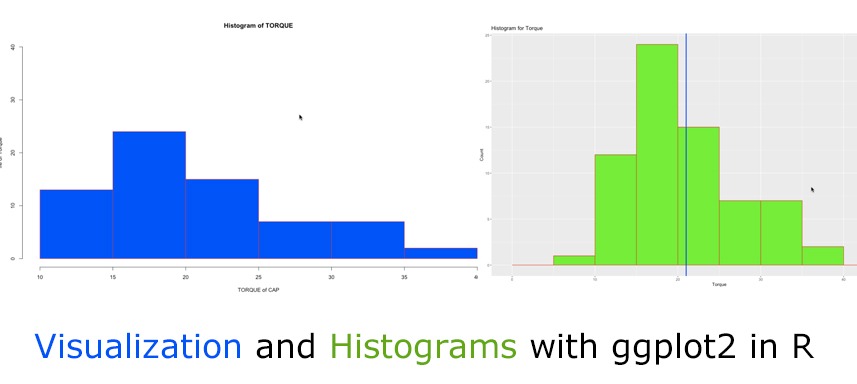
R language allows to do charts, plots and visualizations in multiple ways as part of a data science or AI project. Basic functions are available in R for plotting. There are also specific charting libraries like ggplot2, plotly etc. that can be used to make beautiful and improved charts and visualizations. In this blog let […]